Nodes & Capacity
This is the platform-admin operational view of your node fleet: where you see every node Miabi can schedule work onto, check that each one is healthy, and understand how much capacity is available.
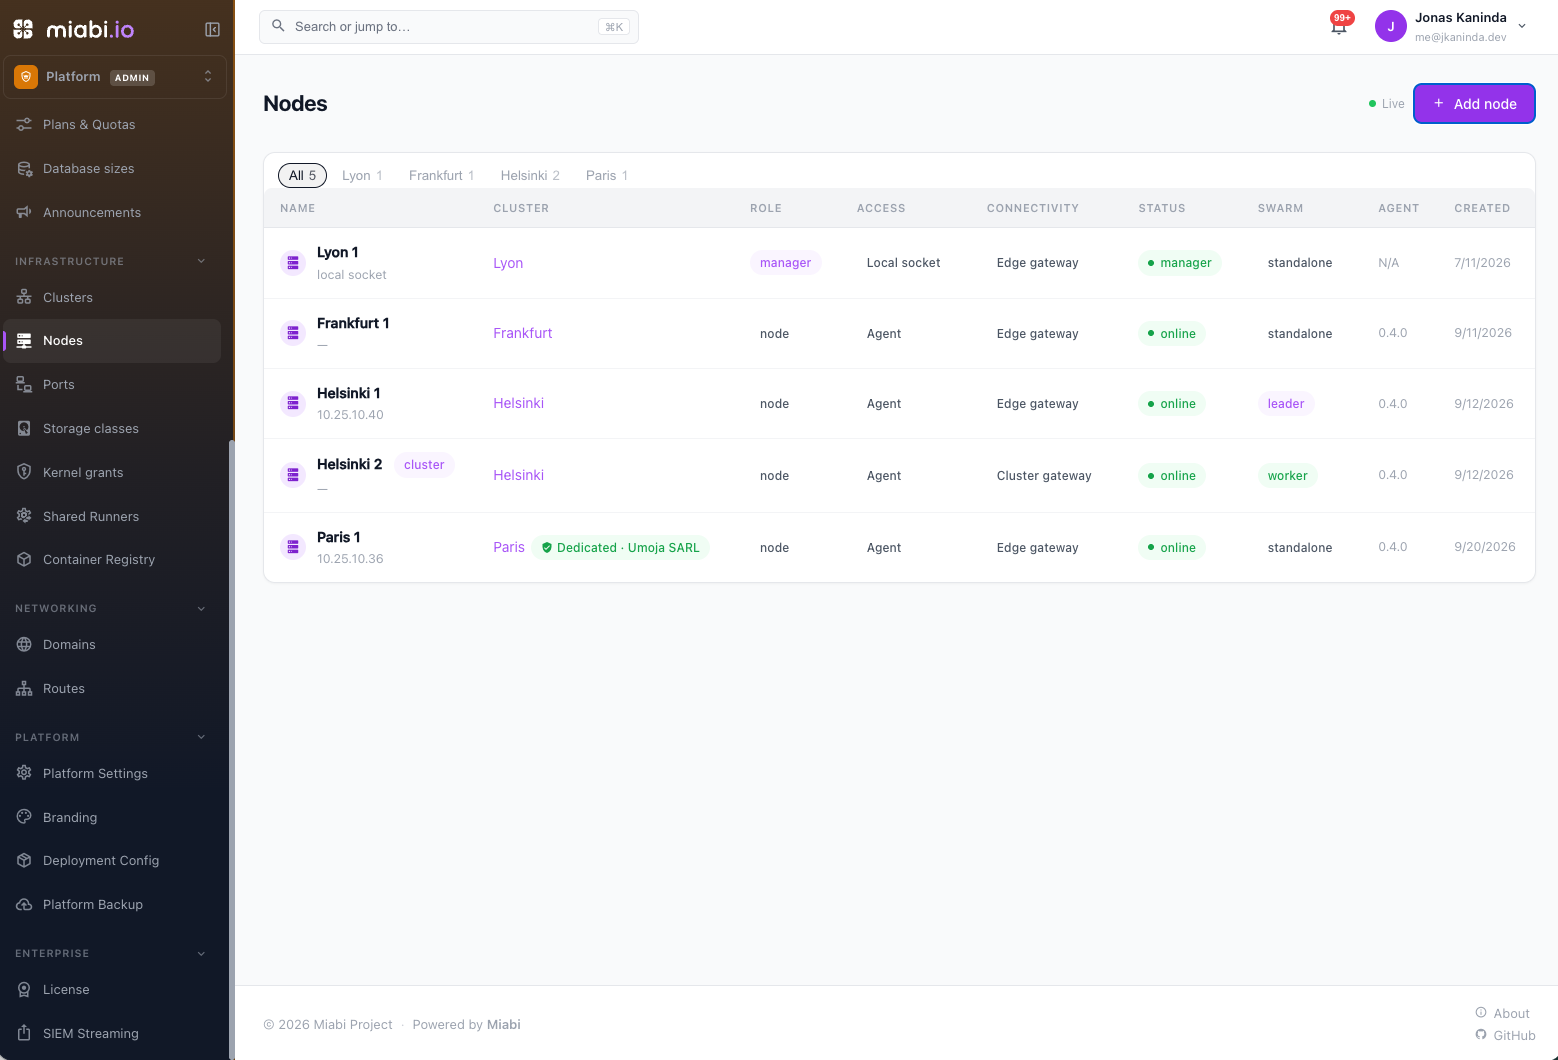
Adding a node to the fleet is a separate workflow — see Adding a Node. This page covers monitoring and managing the nodes you already have. For background on what a node is, read the Nodes Overview.
Viewing the fleet
Platform admin → Nodes lists every node connected to the instance. For each node you can see:
| Column | Shows |
|---|---|
| Name | The node, with a cordoned badge when it is closed to new placements |
| Cluster | The cluster it belongs to |
| Role | manager for the control-plane host, otherwise its role in the cluster |
| Access | How Miabi reaches its Docker engine: local socket, agent, or Docker API |
| Connectivity | Whether its traffic comes in through the cluster gateway or its own edge gateway |
| Status | Reachability, below |
| Swarm | The Swarm state, when any node is in a swarm |
| Agent | The agent version, for agent-mode nodes |
Open a node for the operational detail: running versus total containers, images, volumes and
networks; live CPU and memory (read from the host when the control plane can see /proc, otherwise
added up from container stats); storage; GPUs; every container, published port, volume and network on
it; and, from there, housekeeping and Docker import.
Storage appears in two places on the node page:
- Resource usage → Storage is the disk holding Docker's data root, where images, containers and volumes without a storage class live. It shows used and total space, and the bar turns amber at 85% full.
- Storage classes lists every class whose volumes can land on this node: the classes registered on it, plus shared classes registered on another node of its cluster. Each row shows the class's path, used and total space, and reclaim policy. The card is hidden when the node has only the built-in class, which is the data-root disk above.
Storage figures come from a periodic measurement on the node, not a live reading, so they are still shown while the node is offline. A disk that has not been measured yet reads Not measured yet.
The admin dashboard summarises the fleet: nodes online out of total, how many are offline or cordoned, and clusters split into swarm and standalone.
Status & health
| State | Meaning |
|---|---|
| manager | The control-plane host itself, always reachable. |
| online | The node's agent tunnel is connected. |
| offline | No live tunnel. Existing workloads may still be running on the host, but Miabi cannot reach it to deploy, inspect or schedule. |
Every control plane probes the tunnels it holds each minute and tears down any that stopped responding, so a node that dropped ungracefully does not keep showing online. When a node goes offline, check its network connectivity, the agent, and the Docker daemon on that host. Health signals also feed into Monitoring, where you can chart resource usage over time and set up alerts.
Capacity & assignment
Capacity is the headroom you have for new deployments.
Keep some headroom on every node. Running nodes near 100% utilization leaves no room for rolling deploys, image builds, or sudden traffic — and makes a single node failure harder to absorb.
When you deploy an application, Miabi places it in a location. In a standalone cluster that is its only node. In a swarm cluster a container app goes to the online, uncordoned node with the least container memory already placed on it, and a service app is placed by the Swarm scheduler. A platform admin can also pin a node.
Node pools
A pool groups nodes by hardware or tier, such as pro or gpu; set it from the node's detail
page. On its own a pool binds nothing — Enterprise plan placement
keeps a plan's workspaces on its pool's nodes. See Node pools.
Cordoning a node
Cordon on a node's detail page closes it to new placements; Uncordon opens it again. Cordoning moves nothing: workloads already on the node keep running there until you redeploy or remove them.
To actually move work off a swarm node — before a reboot, say — set its Swarm availability to drain, which reschedules its service tasks elsewhere. Swarm never rebalances on its own when the node comes back. See Availability: draining a node.
A license may cap how many nodes can be registered; see Licensing.
Where to go next
- Nodes Overview — concepts and architecture.
- Adding a Node — grow the fleet.
- Cluster Mode — clusters, locations, pools and draining.
- Monitoring — usage trends and alerts.