Monitoring
Miabi continuously samples resource usage for your containers and rolls it up into per-workspace health, so you can see how apps are behaving without wiring up external tooling — though you can plug into Prometheus when you want to.
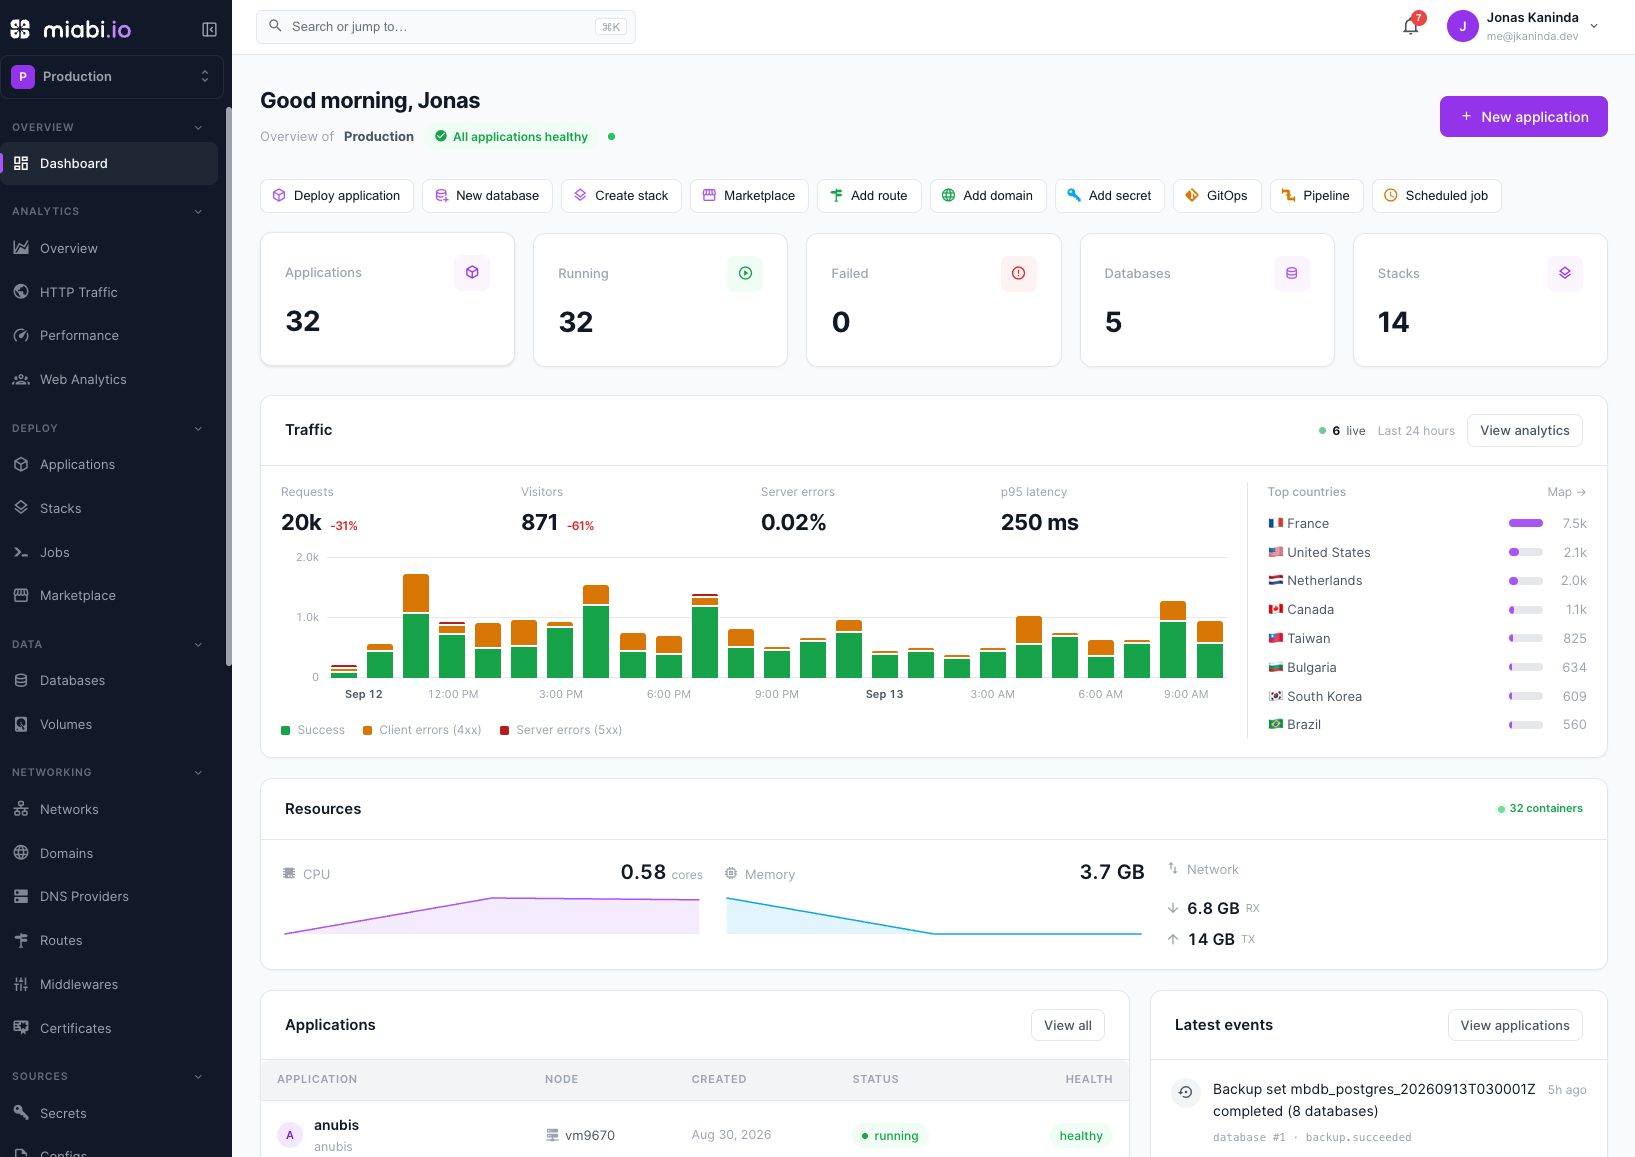
Metrics
For every running container Miabi collects:
- CPU usage
- Memory usage
- Network in and out
These are aggregated into a workspace health view so you can spot a struggling app at a glance, then drill into the individual container that's under pressure.
Retained history
Samples are stored as retained history, not just live readings, so you can look back at trends — a memory leak creeping up over hours, a CPU spike that lined up with a deploy, or disk filling toward a limit. Charts in the console render this history per app and per workspace.
Three settings control the data:
| Setting | Default | Controls |
|---|---|---|
MIABI_METRICS_ENABLED | false | Turns on the history scraper and the Prometheus /metrics endpoint. Off by default: no history is recorded until you enable it |
MIABI_METRICS_SCRAPE_SECONDS | 60 | How often metrics are sampled |
MIABI_METRICS_RETENTION_HOURS | 24 | How long history is kept |
Tune the scrape interval down for finer resolution, or up to reduce overhead; tune retention to match how far back you need to investigate. See Configuration for how to set these.
Shorter scrape intervals give sharper charts but generate more data. Pick a retention window that covers your typical incident-investigation timeframe (often 24–72 hours) without storing more than you need.
Live workspace usage
Beyond per-container charts, Miabi shows live, aggregated resource usage for a whole workspace — actual CPU, memory, and network summed across all its running app and database containers, updating in real time (not a page refresh).
- The dashboard carries a compact Resources card: live CPU cores, memory, network RX/TX, and the number of containers being sampled.
- The workspace Usage tab shows the same live figures alongside your plan quotas.
Both are seeded from retained history and then track live, so each metric renders a small sparkline of its recent trend. This is distinct from the quota view, which reports declared reservations and counts rather than live consumption.
Prometheus integration
Miabi exposes a built-in Prometheus client. With MIABI_METRICS_ENABLED=true, point a Prometheus
server at the instance's /metrics endpoint to scrape Miabi's metrics into your own monitoring stack,
then build dashboards (for example in Grafana) and alerting rules on top of them. The endpoint is not
served while metrics are disabled.
This is the path to use when you want long-term retention beyond Miabi's own history, cross-host aggregation, or alerting that ties into your existing on-call tooling. Miabi exports:
| Metric | Meaning |
|---|---|
miabi_build_info{version,commit} | Running build; always 1 |
miabi_leader{lease} | 1 while this process holds the control-plane lease, 0 on a standby — see leader election |
miabi_network_subnet_pool_used / miabi_network_subnet_pool_total | Subnet-pool utilization, so you can alert before exhaustion — see Networks & Subnets |
miabi_gpu_devices_total / miabi_gpu_devices_enabled / miabi_gpu_allocated | GPU inventory and allocation — see GPUs |
miabi_analytics_ingested_events_total{node} / miabi_analytics_rejected_events_total{node} | Gateway request events accepted from edge nodes, and events dropped because the node does not serve the route they claim |
miabi_control_manager_sweep_duration_seconds | Duration of a reconciliation sweep |
miabi_control_manager_drift_items{class,kind} | Workloads and volumes the last sweep confirmed missing or replaced |
miabi_control_manager_blocked_apps | Apps blocked from redeploying because their data volume is gone |
miabi_control_manager_unobserved{scope} | Nodes and clusters the last sweep could not check |
miabi_control_manager_actions_total{action,result} | What enforcement did, by action and outcome |
The control-manager metrics are described in Reconciliation.
The console's built-in charts and the Prometheus endpoint are complementary: the console is for quick, in-product visibility; Prometheus is for long-term storage, custom dashboards, and alerts.
Health
Workspace and application health summarize the underlying metrics and container state into a simple status, giving you a fast answer to "is everything okay?" before you dig into individual charts.