The Web Console
The Miabi web console is the primary way to operate the platform. It is a Vue 3 single-page app
embedded in the control-plane binary and served at /, so it is always in sync with your instance —
nothing extra to deploy.
Anatomy
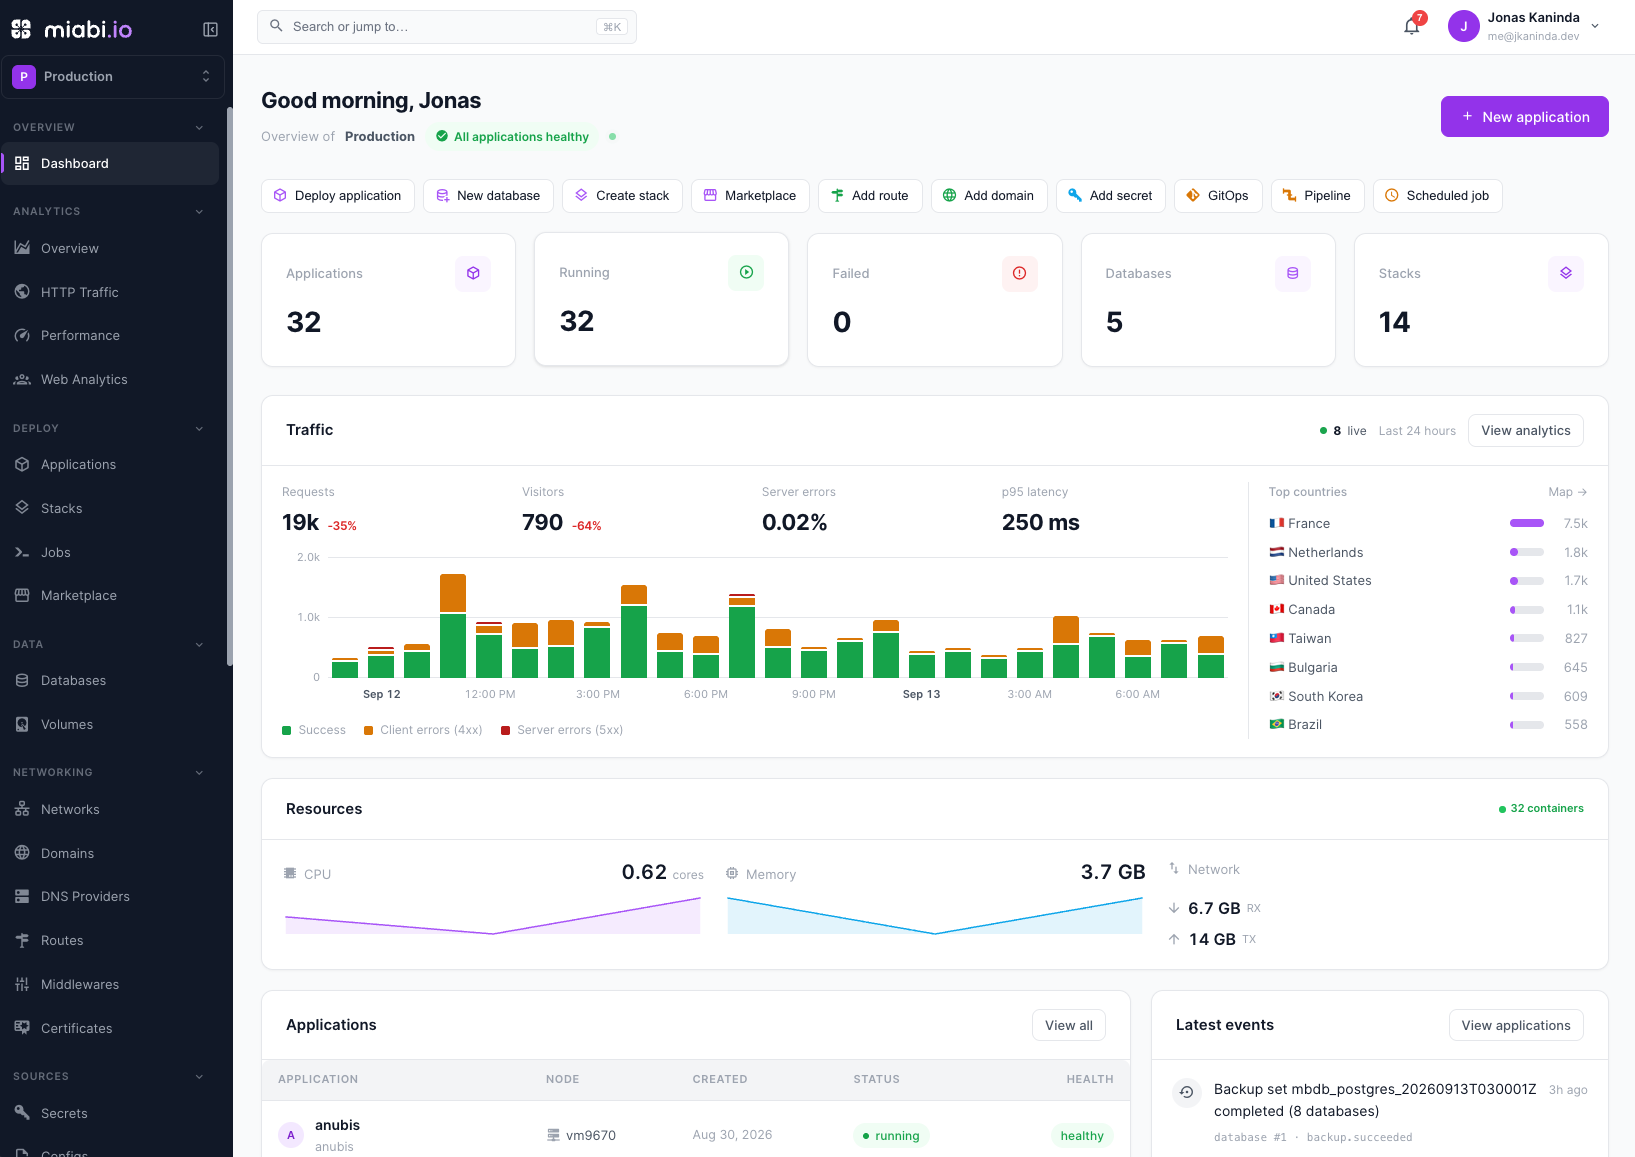
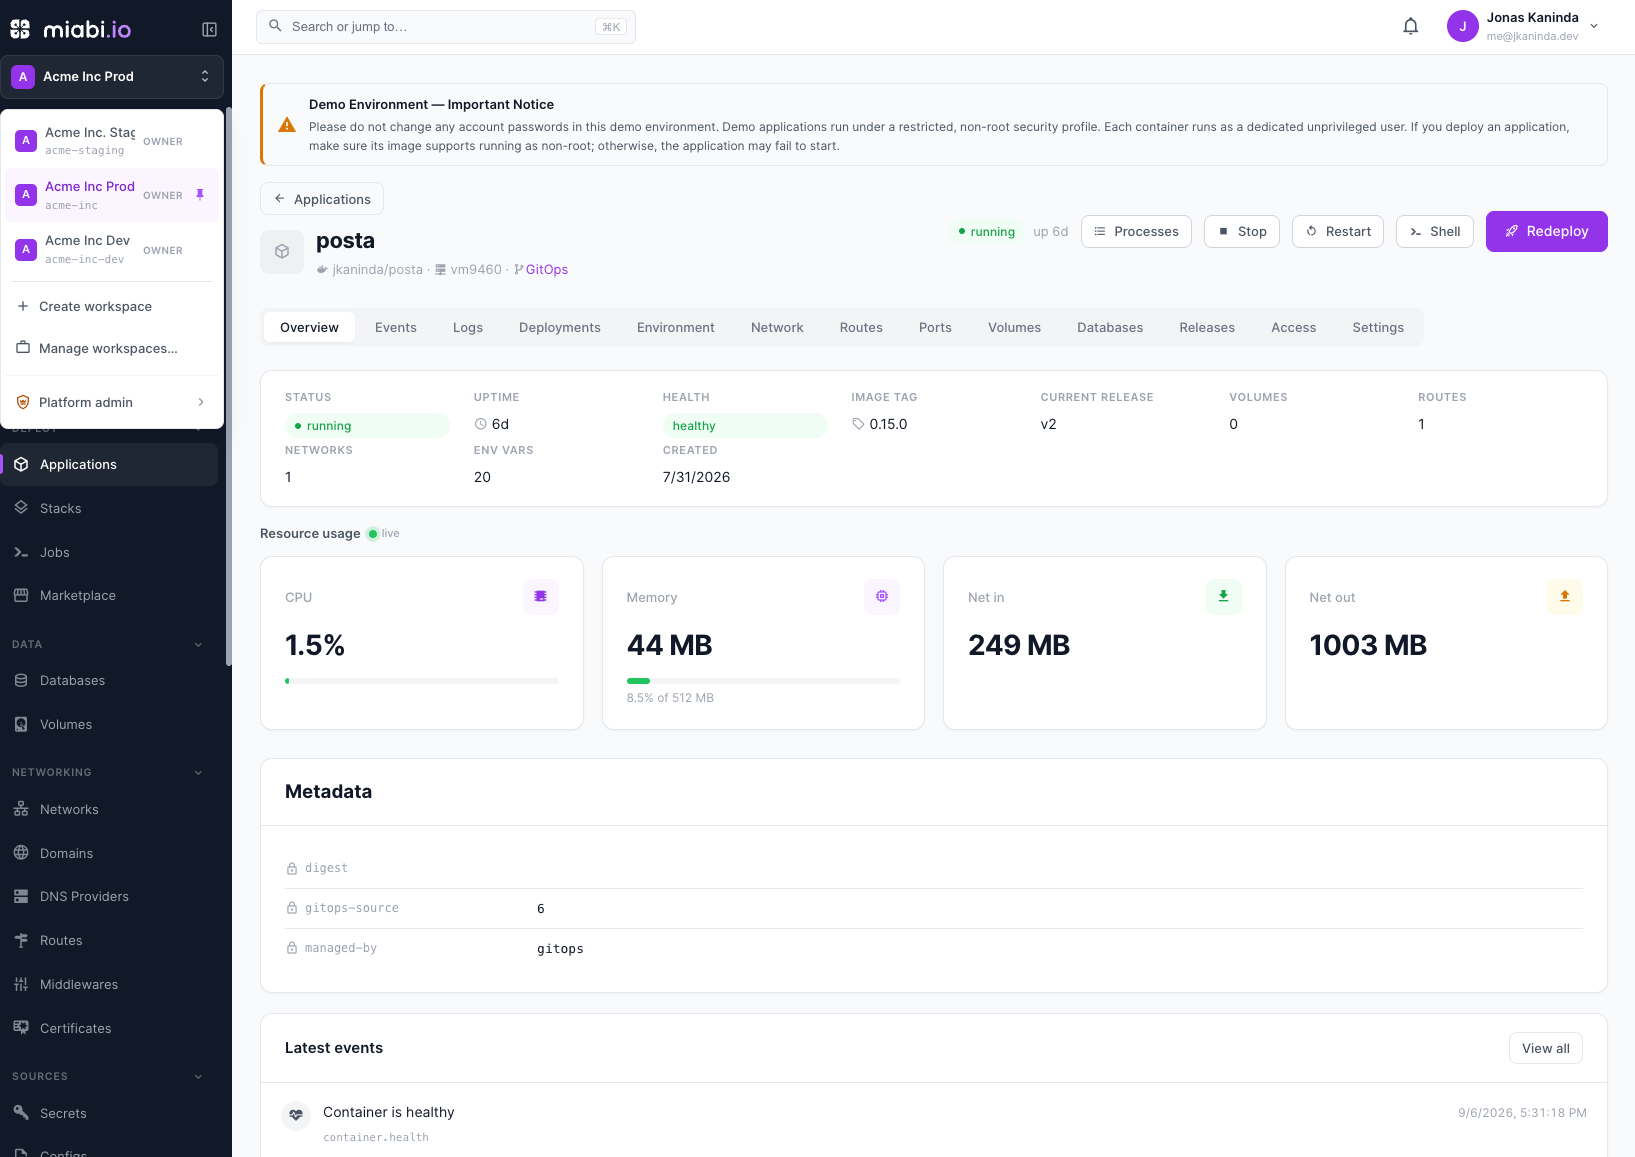
- Workspace switcher — every screen operates in the context of the active workspace. Switch workspaces (or your personal space) from the switcher; the rest of the UI re-scopes instantly.
- Sidebar navigation — grouped into sections: Overview, Analytics, Deploy (Applications, Stacks, Jobs, Marketplace), Data (Databases, Volumes), Networking, Sources (Secrets, Configs, Registries, Git Repositories), GitOps & CI/CD, Developers, and Workspace (members, events, audit log, notifications, settings).
- Dashboard — an at-a-glance overview of the workspace, roughly in the order you care about it: anything failing (as a banner you can act on), quick actions for the things you start most, the app/database/stack counts, a Traffic card with the last 24 hours of requests and who is on the site right now, live CPU/memory/network, and then the inventory — applications, stacks, and a running feed of workspace activity.
The platform admin console
Platform administration is a separate console with its own sidebar, not a section appended to the workspace menu. A platform admin enters it from the workspace switcher → Platform admin, and leaves it the same way.
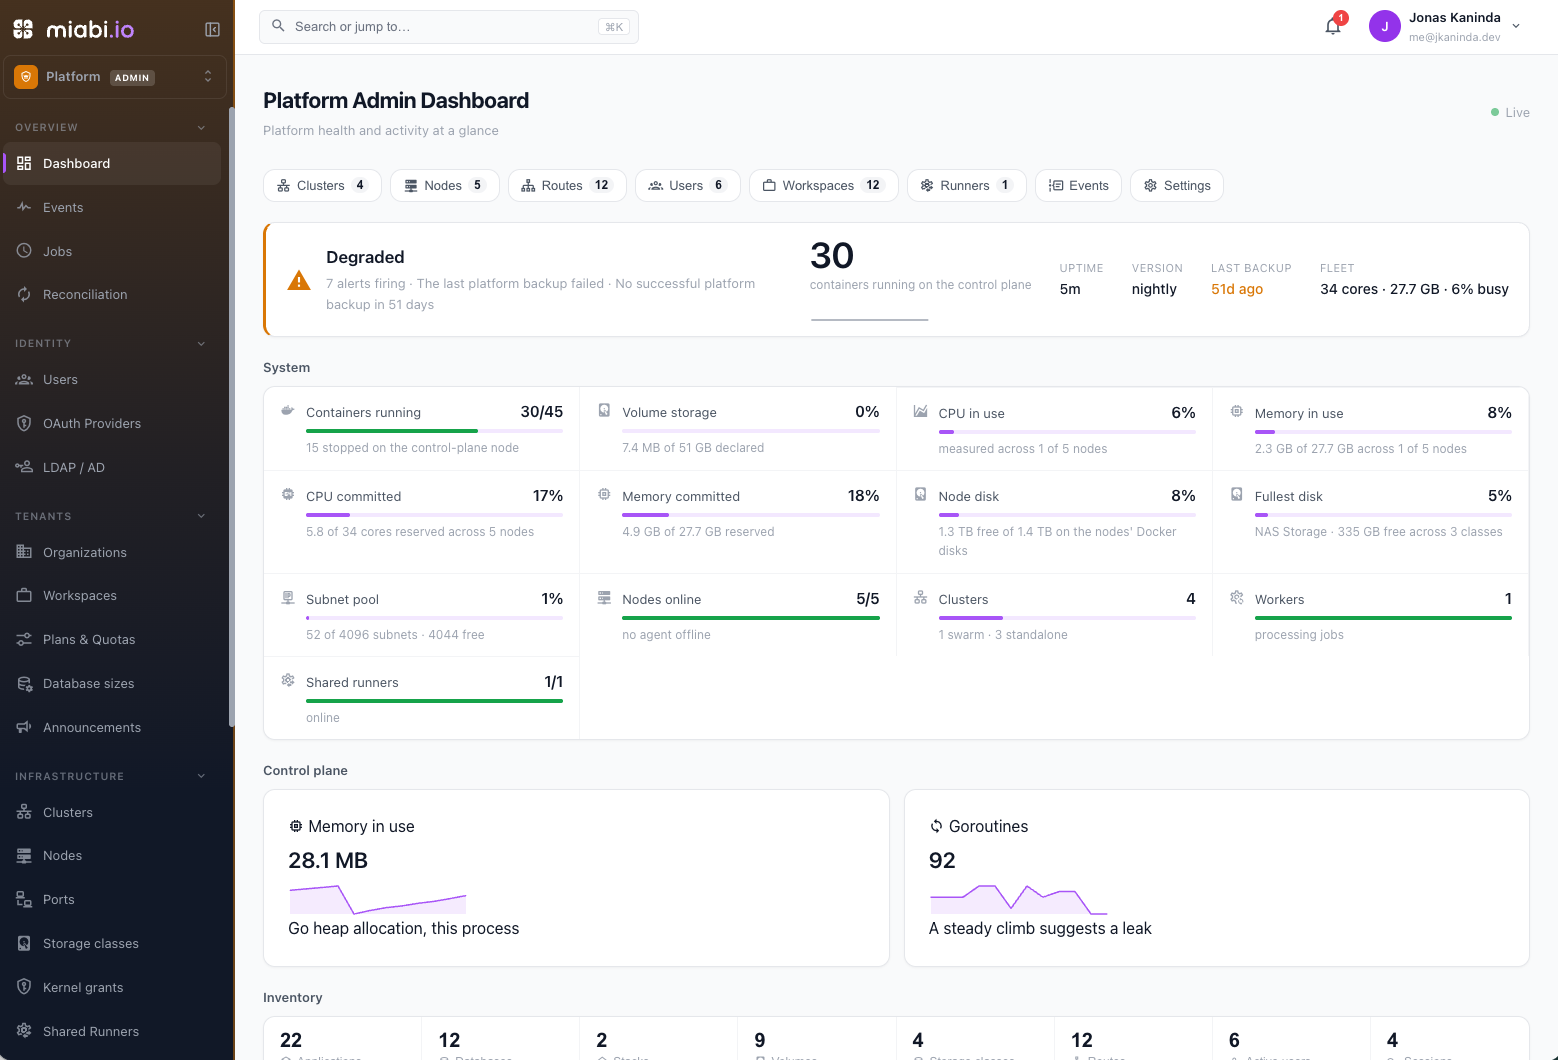
It opens on a dashboard of instance health: an overall status with the reasons behind it, nodes and clusters, workers, the control plane's own memory and goroutines, an inventory of everything on the instance, and recent activity. Its sections are Overview (dashboard, events, jobs, reconciliation), Identity, Tenants (organizations, workspaces, plans, database sizes, announcements), Infrastructure (clusters, nodes, ports, storage classes, kernel grants, shared runners, registry), Networking (domains, routes), Platform (settings, branding, deployment config, platform backup) and Enterprise. See Platform Admin.
Search and jump
Press ⌘K (Ctrl+K on Windows and Linux), or click Search or jump to… in the top bar, to open the command palette. It searches the active workspace and navigates the console from one place:
- Resources — applications, stacks, databases, volumes, networks, domains, routes,
certificates, secrets, configs, pipelines, GitOps sources, environments, registries and Git
repositories. Both the handle and the display name are matched, so an app named
mb-7f3ashows up when you type its label. - Pages — every sidebar destination you have access to, so ⌘K then
perfreaches Performance without opening a section. - Workspaces — type
@to switch.
Narrow a search by prefixing a kind: app:, db:, route:, secret:, gitops: and the rest.
↑↓ move, ↵ opens, ⌘↵ opens in a new tab, and
recently opened resources are offered before you type anything.
Results are scoped to the active workspace and to your role in it, and never include a secret's value — only its name and description.
The same search is available on the API as GET /api/v1/workspaces/{workspace}/search?q=.
Theme and preferences
The console has a light and a dark theme, plus System, the default, which follows your operating system. Switch from the user menu, or from the sign-in page before you log in.
Account → Preferences holds the rest, all saved to your account so they follow you to other browsers:
- Default workspace — the workspace a new session opens in, and Open on, the section it opens on.
- Appearance — light, dark or system.
- Accent — the console's accent colour. When an operator enforces the brand accent, the choice is locked for every account.
- Time zone — how times are displayed; they are always stored in UTC.
- Language — English or French; the whole console is translated.
Everything is an API
The console never holds business logic of its own — every action it performs is a call to the same
public REST API you can use directly. That means anything you see in the UI is automatable. For
endpoint-level detail, open the interactive API reference at /docs on your instance, or browse the
hosted API reference.
Working against the API directly? Create an API token scoped to a workspace and call the same endpoints the console uses.
Real-time updates
Long-running operations — deploys, builds, backups, log streams — push live updates to the console over server-sent events, so you watch progress without refreshing.