Workspace Analytics
Workspace Analytics answers "who is hitting my apps, how fast, is anything failing, and is anyone on the site right now?" — without adding a single line of code to your app. Every request already flows through Goma Gateway; Miabi turns that stream into minute-bucketed rollups and four dashboards, scoped per workspace (and per app).
It is privacy-first by design: cookieless, the client IP is resolved to a country at the edge and then dropped, unique visitors are counted with a daily-salted hash, and no per-request rows or PII are ever stored.
The dashboards are rollups of a per-request event stream that only Goma
publishes. Requests to your apps never pass through the Miabi control plane, so
there is no second source to fall back on: on an install that uses a different
edge proxy (for example the Traefik Compose
variant),
every panel — Traffic, Performance, Web Analytics and the live-visitor count —
stays empty rather than partially populated. Set MIABI_ANALYTICS_ENABLED=false
there so no consumer runs waiting on a stream nothing writes, and use your
proxy's own metrics or access logs instead.

The four views
Open Analytics in the sidebar. A shared header carries the time range (30 min · 1h · 24h · 7d · 30d), an app filter, a live visitor count, and the absolute window the relative range resolves to — all four tabs share them.
-
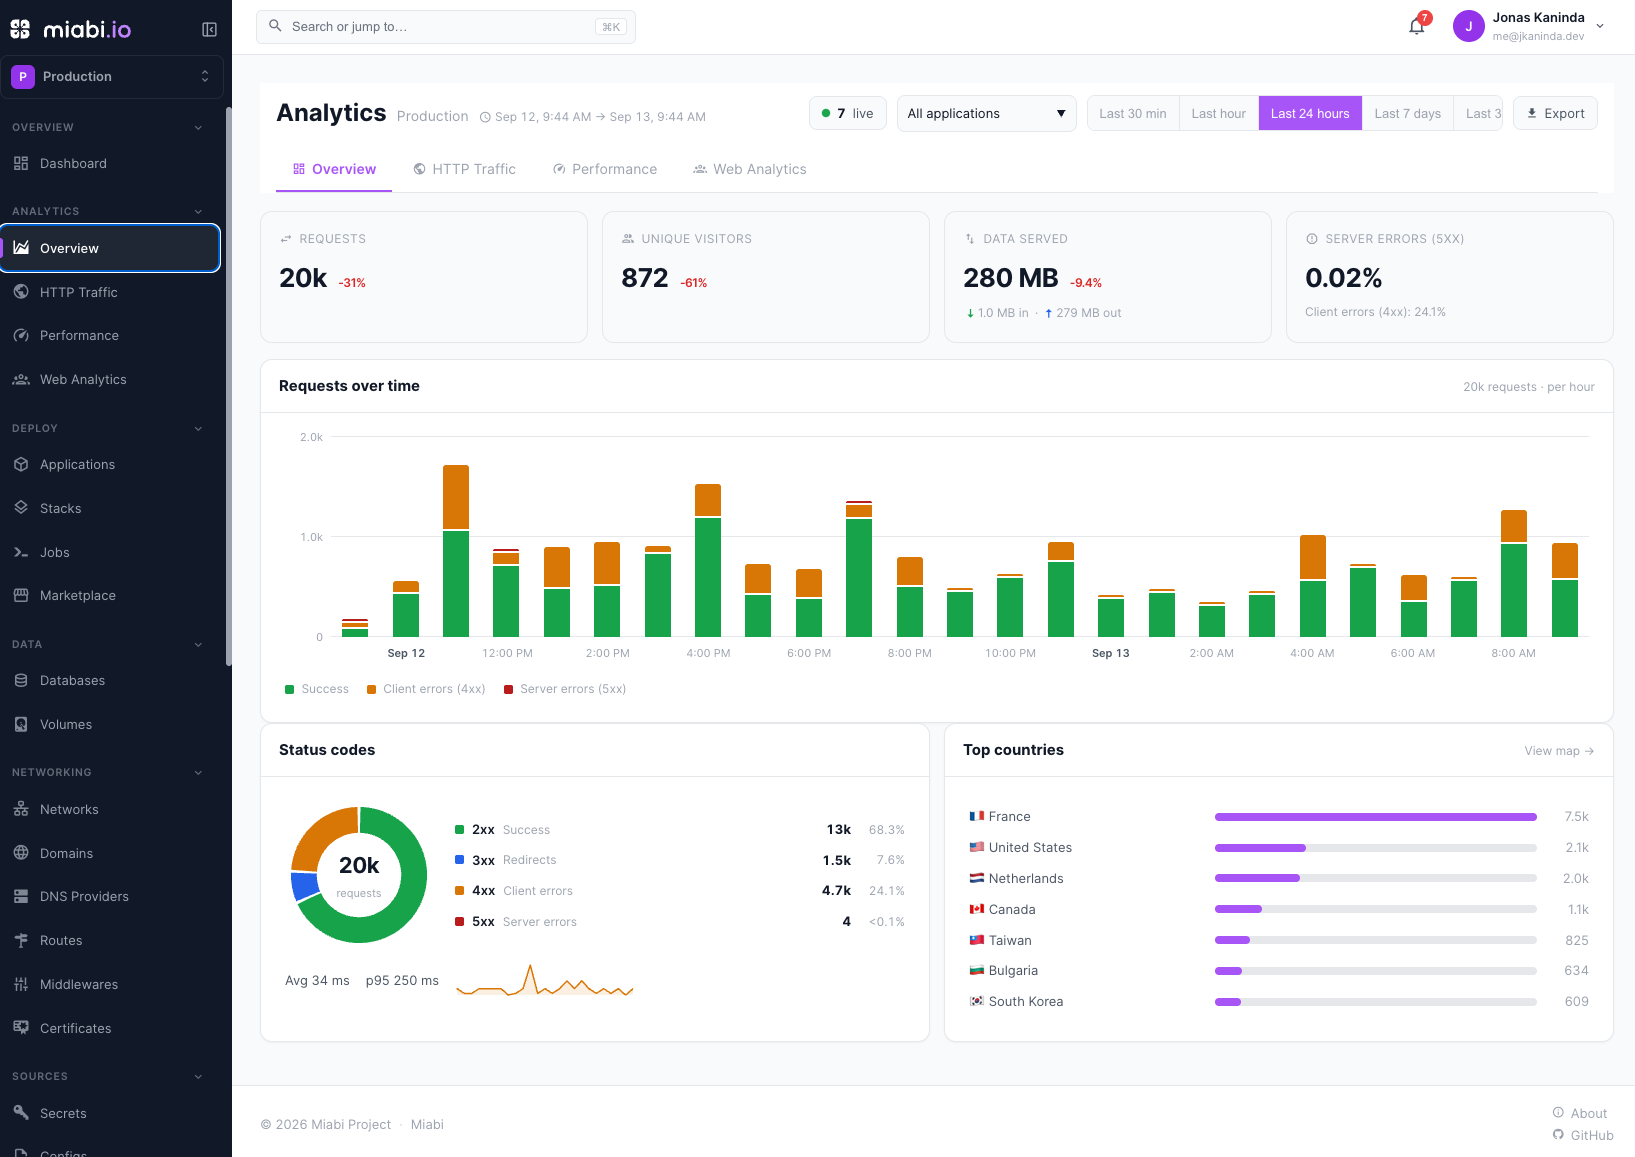
Overview — headline tiles (requests, unique visitors, data served, and server errors (5xx) with client errors (4xx) beside it), a requests-over-time chart that separates success / 4xx / 5xx, and the status-code split as a ring with every class and its count beside it.
-
HTTP Traffic — a world map of requests by country (from GeoIP), plus breakdowns by country, method, status code and path. Paths are the request paths the gateway saw (
/api/v1/orders/42), ranked and capped at the busiest few — so an app with ids in its URLs shows many low-count rows rather than one grouped/api/v1/orders/:id.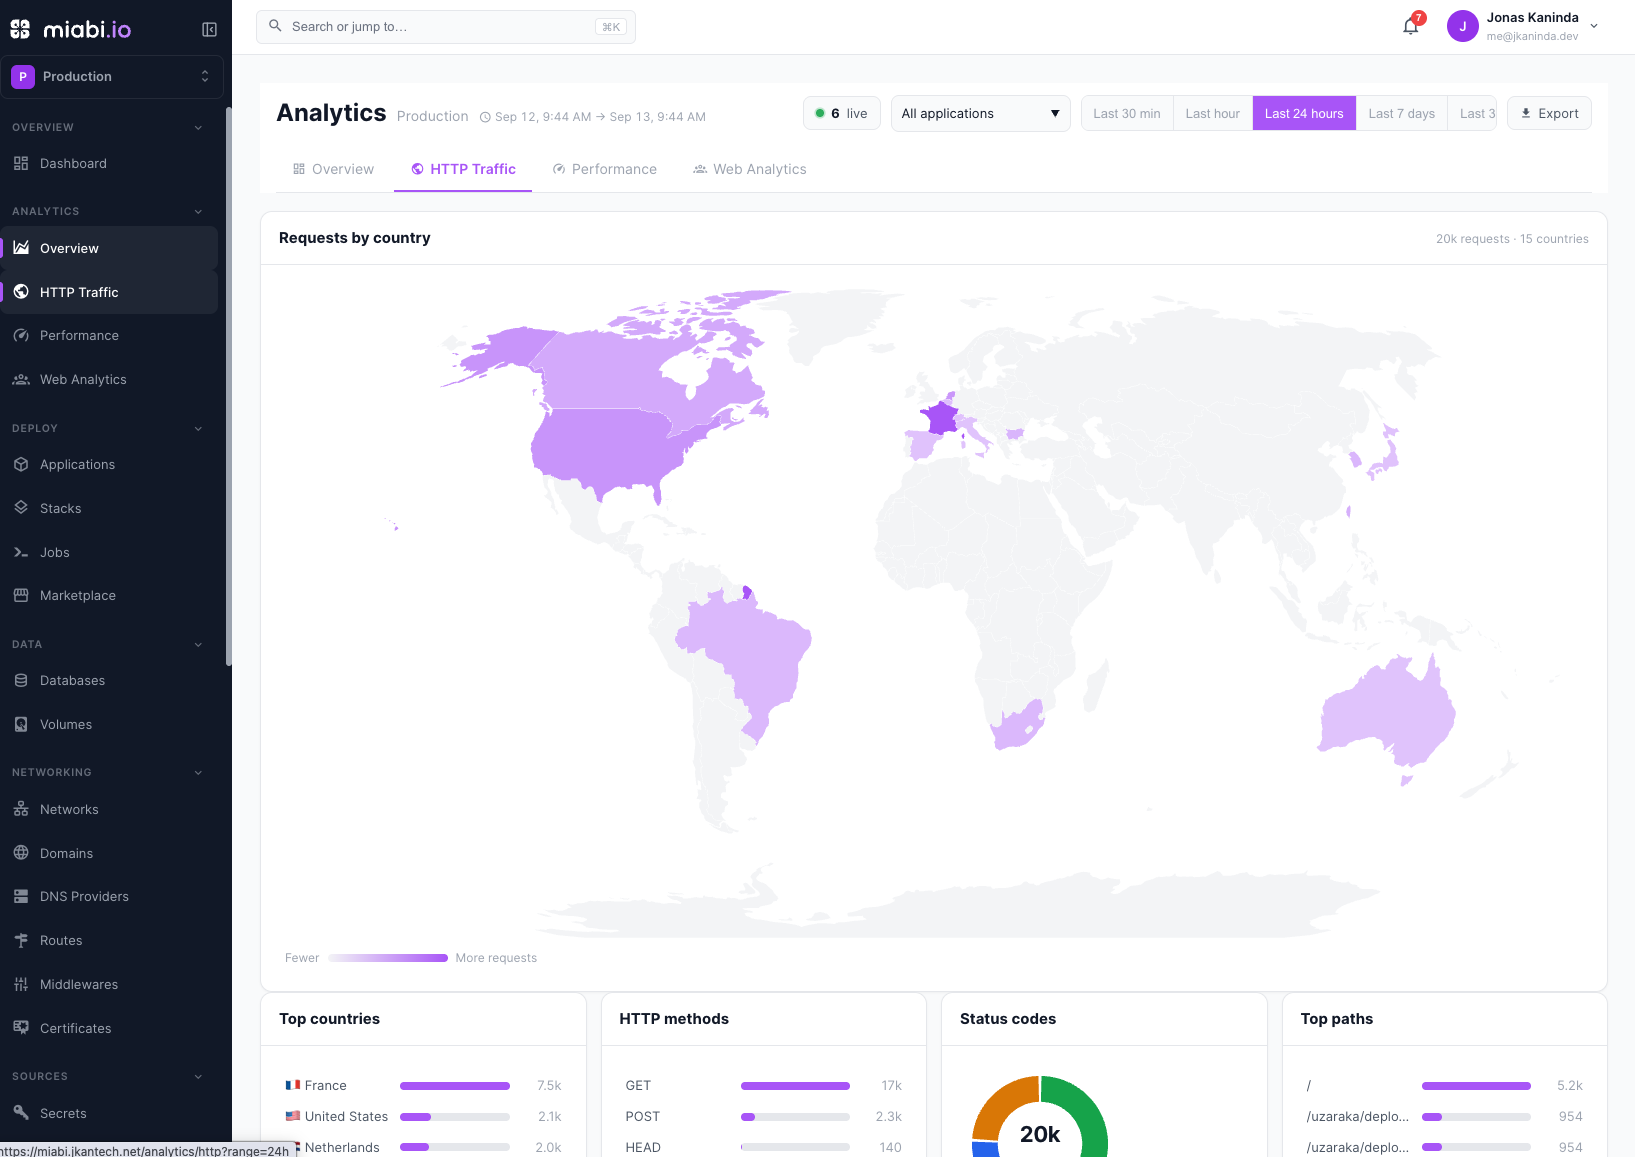
-
Performance — request vs. upstream latency percentiles (p50/p95/p99), gateway overhead (total − upstream), p95 over time, and the slowest routes.
-
Web Analytics — cookieless visitors, page views, and audience breakdowns: top pages, referrers, countries, browsers, operating systems, devices, and a human-vs-bot split.
curlis reported as its own browser family, and a Top user agents panel lists the rawUser-Agentstrings (clipped to 180 characters), so you can see exactly which clients and scripts are calling.
Client errors (4xx — 404s, failed auth, bots) are usually noise; server errors (5xx) are the real health signal. Analytics keeps them separate everywhere, and the Overview error tile leads with the 5xx rate so a flood of 404s never reads as an outage.
Charts label their axis in your browser's timezone, and the header spells out the absolute window behind the relative range. The one exception is the 7-day and 30-day views: those bucket by UTC day, so they are labelled in UTC — a bucket cut at UTC midnight would otherwise be shown under the wrong date for anyone west of Greenwich. Tooltips on daily bars say so.
Live visitors
The analytics header and the workspace dashboard both show a live visitor count: distinct visitors seen in the last five minutes, per workspace (and per app when the filter is set). It comes off the same event stream as everything else, keyed on the same daily-salted visitor id — no cookies, no extra instrumentation.
Bots are excluded, using the same user-agent rule as the human-vs-bot split, so a crawler sweeping the site doesn't read as an audience.
The window matters more than it looks: it spans the gap between one visitor's
requests, not the length of their visit. Somebody reading a page sends nothing
for minutes and is still there, which is why five minutes is the norm across
analytics products. A gateway fronting an API, whose clients poll every few
seconds, reads truer lower — set MIABI_ANALYTICS_LIVE_WINDOW_SECONDS to change
it.
Goma also exposes its own real-time visitors Prometheus gauge, computed
independently and gateway-wide (no workspace dimension). If you change the window
on one side, change it on the other — Miabi's
MIABI_ANALYTICS_LIVE_WINDOW_SECONDS and the gateway's monitoring.visitorTTL
default to the same five minutes, and will disagree visibly if they drift apart.
On the workspace dashboard
You don't have to open Analytics to see whether traffic is healthy. The dashboard carries a Traffic card: requests, visitors, 5xx rate and p95 for the last 24 hours — each against the previous 24 hours — plus the requests-over-time chart and the live visitor count. It reads a lighter summary endpoint than the full dashboards, so it costs a fraction of a report, and it hides itself if analytics isn't reachable rather than showing an error on an otherwise-working dashboard.
Apps on edge-gateway nodes
An app served by a node's own edge gateway is counted too. That gateway
publishes its events into the node's local Redis as a store-and-forward buffer, and the node's agent
drains it to the control plane, which appends them to the same goma:analytics stream. Nothing extra
needs configuring, and a node that is briefly disconnected catches up when it reconnects.
The control plane only accepts events for routes the reporting node actually serves; anything else is
dropped and counted in miabi_analytics_rejected_events_total{node} (see
Monitoring), since a node claiming someone else's
traffic is a compromise signal.
Enabling it
Analytics is on by default, but it needs the gateway to emit events and both sides to share the same Redis database. This applies to the manager's gateway; edge-gateway nodes forward through their agent instead (see above).
-
Goma Gateway — enable the event stream (and, for the country panels, mount a GeoIP database). Either in
goma.yml:gateway:
analytics:
enabled: true
stream: goma:analytics
geoip:
database: /etc/goma/country.mmdb # optional; see "GeoIP database" below…or from the gateway's environment, which overrides the file:
GOMA_ANALYTICS_ENABLED=true
GOMA_ANALYTICS_STREAM=goma:analytics
GOMA_REDIS_DB=0            # must equal Miabi's MIABI_REDIS_DB
GOMA_GEOIP_DB=/etc/goma/country.mmdb   # optional; see "GeoIP database" below
The Compose example ships both already set.
-
Miabi — the consumer reads that stream (defaults shown):
MIABI_ANALYTICS_ENABLED=true
MIABI_ANALYTICS_STREAM=goma:analytics
MIABI_ANALYTICS_FLUSH_SECONDS=15
MIABI_ANALYTICS_RETENTION_DAYS=90
MIABI_ANALYTICS_LIVE_WINDOW_SECONDS=300   # how long a visitor counts as "live"
MIABI_REDIS_DB=0          # must equal Goma's GOMA_REDIS_DB
Data appears a couple of minutes after traffic starts (closed minute buckets flush on a short grace window) — except the live visitor count, which is immediate.
GeoIP database
The country map and the geo-block middleware need a GeoIP database on the gateway. Miabi ships and downloads none — see why — so this is a one-time manual step:
- Download a country-level database in MaxMind-DB (
.mmdb) format — the options are below. - Save it as
/etc/miabi/country.mmdb(besidegoma.yml; if you moved the config withMIABI_ETC, put it there instead). The nameGeoLite2-Country.mmdbis also recognized. - Restart the gateway:
miabi restart miabi-gateway.
Countries start appearing on the next traffic. To turn geo off again without deleting
the file, set MIABI_GEOIP=off.
Where to get one
| Database | License | Cost |
|---|---|---|
| DB-IP IP-to-Country Lite | CC BY 4.0 — you must credit DB-IP wherever the data is shown | Free, monthly |
| IP2Location LITE DB1 | CC BY-SA 4.0 — attribution + share-alike | Free, monthly, registration |
| MaxMind GeoLite2 Country | MaxMind GeoLite EULA — no redistribution | Free, needs a MaxMind account + license key |
| MaxMind GeoIP2 / DB-IP commercial | Commercial terms, no attribution clause | Paid |
Any of them works — Goma reads the MMDB format, not a specific vendor. The free ones are accurate enough for country-level traffic analytics.
The free DB-IP and IP2Location databases require you to credit the source on pages that display their data. If you pick one of those and expose the analytics UI to anyone beyond your own team, add that credit. It is your obligation, not Miabi's — which is part of why Miabi does not choose for you.
Why Miabi does not ship one
MaxMind's GeoLite EULA forbids disclosing their databases to third parties without written consent, so Miabi cannot bundle or mirror GeoLite2 — and the community GitHub mirrors that do are neither licensed to nor stable (they prune old releases, so pinned URLs break within the month).
The permissive alternatives are redistributable, but they oblige whoever displays the data to credit the source. Auto-downloading one would silently make that promise on your behalf, for your deployment, without you knowing it had been made. Handing you the choice is the honest version — and it costs one download.
Retention & export (Community vs Enterprise)
The full dashboards — every tab, the world map, all breakdowns — are Community. Enterprise adds scale and export, not visibility:
| Community | Enterprise | |
|---|---|---|
| All dashboards + world map | ✅ | ✅ |
| Retention | up to 7 days | configurable (30/90d+) |
| CSV export + read API | — | ✅ (analytics_export) |
In Community the range picker locks windows past the retention cap; the Export button is enabled with an Enterprise license.
Troubleshooting
The dashboard is empty even though there's traffic. In almost every case the
gateway and Miabi are on different Redis databases, so the events never reach
the consumer. Confirm GOMA_REDIS_DB equals MIABI_REDIS_DB, then check the
stream is filling:
redis-cli -n <db> XLEN goma:analytics          # should grow with traffic
redis-cli -n <db> XINFO GROUPS goma:analytics   # a "miabi-analytics" group, lag ~0
Also make sure real traffic reached a routed app (the gateway only emits on
proxied requests — hitting the dashboard itself doesn't count), and that the
event's route name looks like mb-ws<id>-<slug> (that prefix is how a request is
attributed to a workspace).
No country data / empty map. The gateway has no GeoIP database — Miabi never
installs one. See GeoIP database; analytics keeps working
without it, just without countries. If you did place the file, check the install
log for GeoIP: using … (it is picked up when the gateway is created, not while
it runs) and confirm the name is country.mmdb.
What it is not
Workspace Analytics is request/traffic analytics, distinct from Monitoring (container CPU/memory/health) and the Audit Log (a compliance record of user actions).