Alerts & Notifications
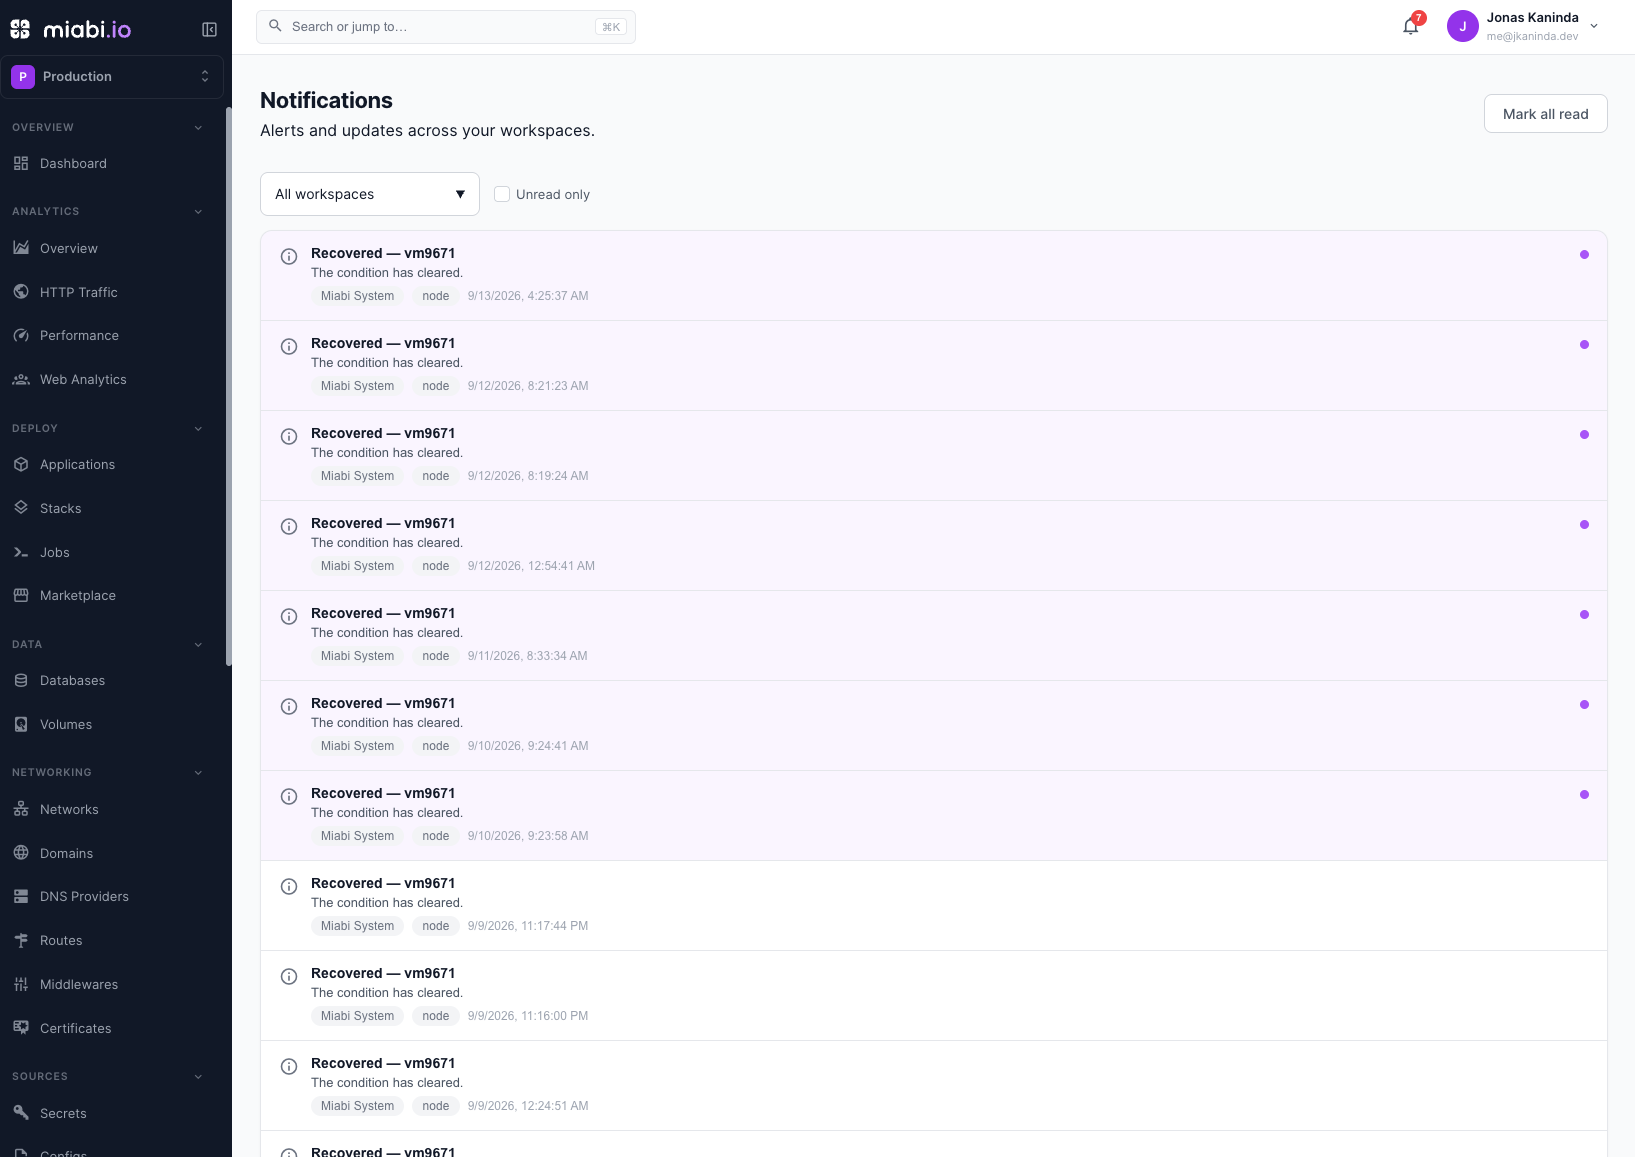
The bell in the top bar and the Notifications page show you the things that actually matter about your workspaces — "your app is crash-looping", "the deploy failed", "this volume is 92% full", "a node went offline" — as a short, actionable list, not a firehose of raw events.
The difference is judgement. A crash-looping app emits ~40 Docker events in two minutes; a naive feed shows 40 red rows. Miabi shows one alert that updates in place ("crash-looping — 8 restarts") and auto-resolves to "recovered" when it stabilizes.

Three layers make that work:
- Signals — raw, factual facts from the platform (container events, deploy and backup outcomes, cert/disk/quota scans, node/runner status).
- Alerts — the derived, deduplicated, stateful conditions. Workspace-level and shared.
- Notifications — the per-user delivery. Read/unread is per user.
What you get — the built-in catalog
Alerts arrive already tuned so a normal deploy is silent and a real problem is one line. Each links to the resource and, where possible, an action.
| Alert | Severity | Fires on | Auto-resolves when |
|---|---|---|---|
| Deploy failed | critical | a build/deploy fails | the next deploy succeeds |
| App crash-looping | critical | repeated container exits in a window | it stays healthy / a good deploy |
| App OOM-killed | critical | a container is OOM-killed | it recovers |
| App unhealthy | warning | the health check fails | it reports healthy |
| Workload missing | warning | an app's container or swarm service disappeared from its node or cluster | it exists again |
| Cannot be brought back | critical | the control manager gave up redeploying a missing app | the workload exists again |
| Data volume lost | critical | the volume holding an app's or database's data is gone, or was recreated outside Miabi | the volume exists again |
| Volume near full | warning → critical | usage ≥ 85% / ≥ 95% | usage drops back |
| Database crash-looping | critical | repeated database container exits in a window | it reports healthy / it starts |
| Database OOM-killed | critical | a database container is OOM-killed | it reports healthy / it starts |
| Database unhealthy | warning | the database health check fails | it reports healthy |
| Database provisioning failed | critical | an instance does not finish provisioning | it is provisioned |
| Database upgrade failed | critical | a version upgrade does not complete | an upgrade succeeds |
| Database backup failed | critical | a backup run fails | the next backup succeeds |
| Recovery point failed | critical | a whole-instance recovery point does not complete, or fails verification | the next recovery point succeeds |
| TLS certificate expiring | warning → critical | < 14 days / < 3 days to expiry | it is renewed |
| Certificate issuance failed | critical | ACME issuance/renewal fails | it is issued |
| Approaching quota | warning | a resource passes 90% of the plan limit | usage drops back |
| Node offline | critical | an agent tunnel drops | the node reconnects |
| Runner offline | warning | a runner tunnel drops | the runner reconnects |
The workload-missing, cannot-be-brought-back and data-volume-lost alerts come from Reconciliation; they fire unless the control manager is off (or the app is set to Leave this app alone).
A repeat signal folds into the existing alert (its count climbs) instead of creating a new one, and it never re-notifies. When the condition clears, the alert auto-resolves and its notification updates to "recovered" — so the bell never floods and never lies.
Severity & lifecycle
- Severities: info (FYI), warning (degraded), critical (down/failing).
- Lifecycle: an alert is
firing→ optionallyacknowledged(you're on it, silence re-notification without hiding it) →resolved(auto when the condition clears, or manually). Resolved alerts are kept as history.
Who gets what
Notifications are workspace- and role-scoped — you only ever see alerts for a workspace you belong to:
- Developers get their apps' and databases' deploy/runtime/backup/TLS/disk and reconciliation alerts.
- Admins/Owners additionally get quota alerts.
- Platform alerts — a node going offline or a shared runner dropping — aren't tied to any tenant workspace. They are attributed to the built-in Miabi System workspace and delivered to platform super-admins. A workspace-owned runner, by contrast, notifies that workspace's members.
Scheduled backups report both outcomes
A backup you start yourself reports itself: you are looking at the row. A backup at 03:00 has nobody watching, which is the only reason its outcome has to go anywhere — so scheduled runs post to the workspace inbox either way, and manual ones stay silent.
| Outcome | What appears | Severity |
|---|---|---|
| Completed | "Recovery point completed — instance", with the databases covered and the size stored | info |
| Failed | "Recovery point failed — instance", with the reason | warning, plus a critical alert |
A failure produces both because the two do different jobs. The alert is the open condition — it dedups, and it auto-resolves when the next run succeeds. The inbox item is the record of that particular run, which stays put after the condition clears.
A recovery point posts one item covering every database it took, not one per database. The per-database backups inside it stay silent for that reason.
Completion notices are not rate-limited. Thirty databases on their own nightly schedules produce thirty inbox items every morning, and an inbox nobody reads is worse than no inbox — the failure gets skimmed past with the rest. Prefer one recovery point schedule per instance, which collapses the whole instance into a single notice.
Delivery
- In-app is always on and real-time. New notifications push to the bell over SSE — the same mechanism as live deploy logs — so the unread badge updates without a refresh. The Notifications page is the full, filterable inbox (by workspace, severity, read/unread), with mark-read / mark-all-read.
- No configuration is required; the engine runs with the platform and keeps its hot state (dedup windows, cooldowns) in Redis so it is correct across replicas.
This is separate from webhooks & notification channels (Telegram/Slack/Discord) that fire on application events, and from the Audit Log (a compliance record of user actions). Routing alerts to email/chat channels and escalation policies are on the roadmap.