Logs & Timeline
Two views give you visibility into what your application is doing: live logs stream output from the running containers, and the timeline records the lifecycle events of the app itself.
Live logs
The Logs tab streams output from your application's containers in real time, straight to the console — no SSH, no docker logs. Watch a deploy come up, debug an error as it happens, or tail steady-state traffic.
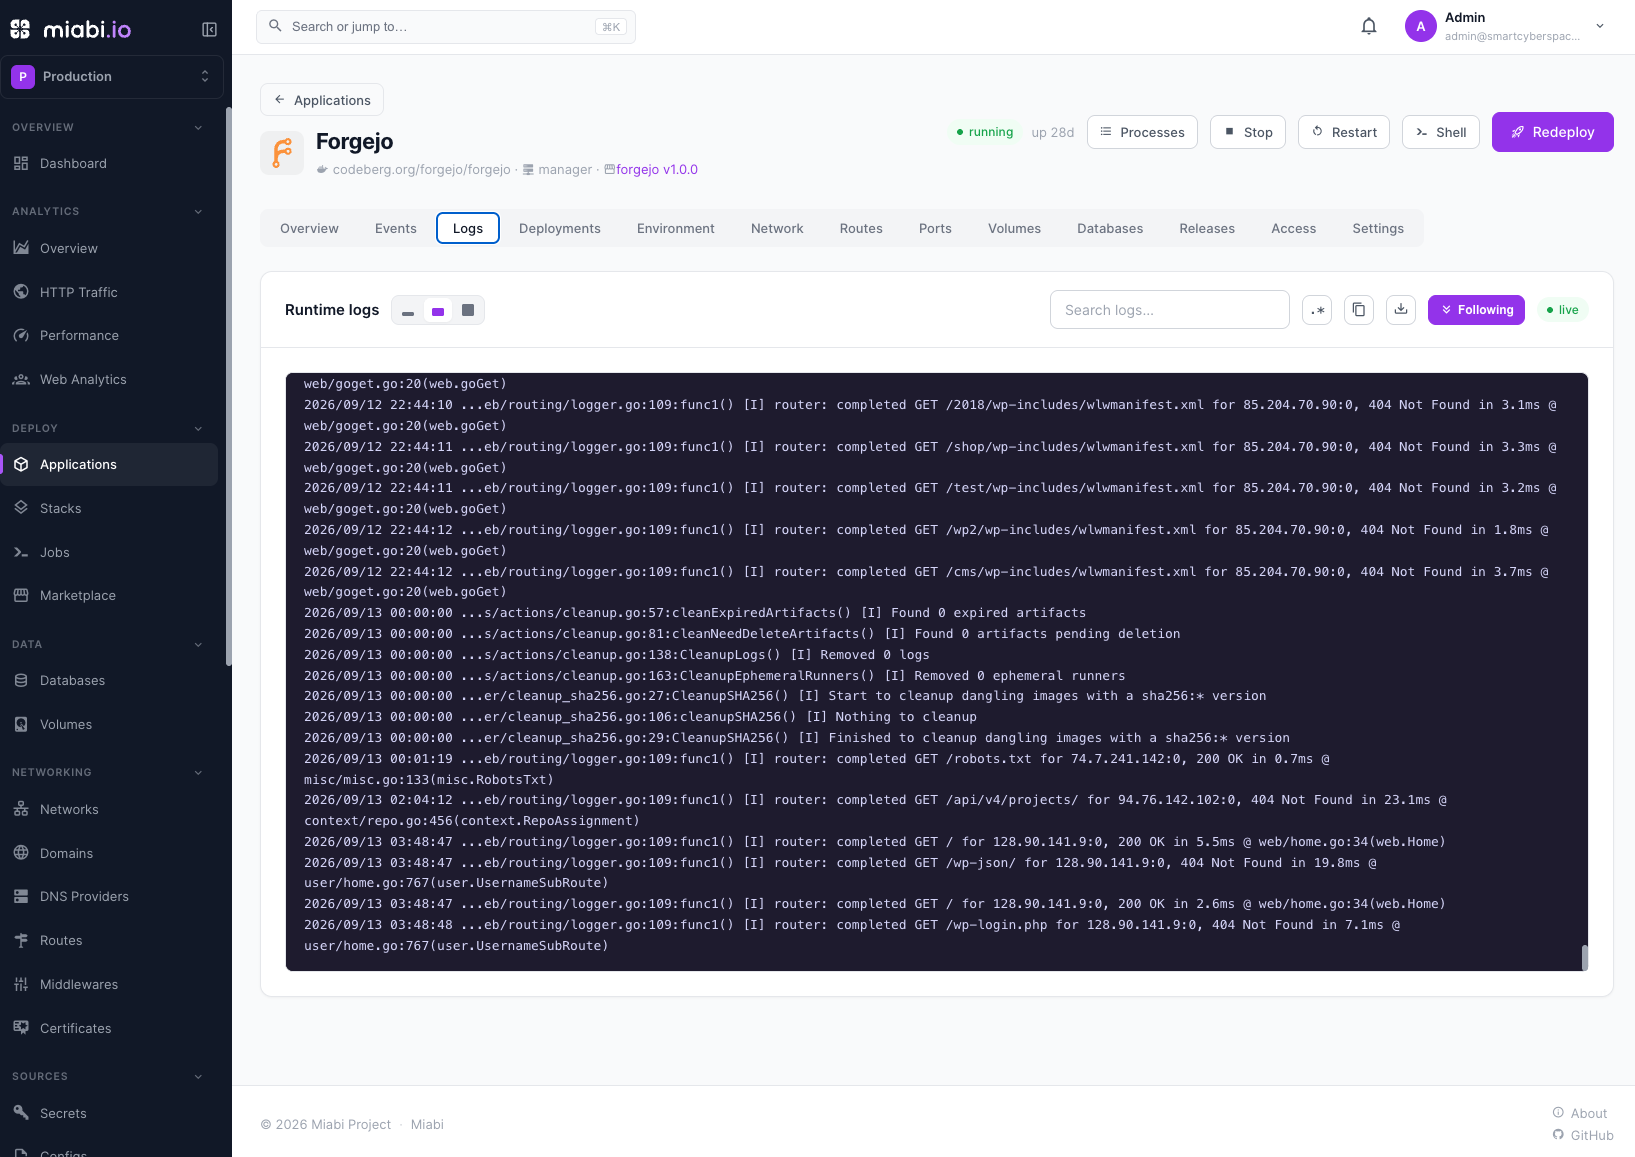
Logs cover the running release and, during a zero-downtime switch, the new container as it starts. Job output streams live on the Jobs page while a one-off command runs.
Have your app write to stdout/stderr — that's what Miabi streams. Structured (JSON) log lines are easiest to scan in the console.
Application timeline
The timeline — the app's Events tab — is a per-app record of lifecycle events: what happened to the application and when:
- Deploys starting, succeeding or failing, and releases being activated
- Rollbacks to a prior release
- Container lifecycle — started, stopped, died, out of memory, health changes, removed
- Settings and environment changes
- Domains, volumes and config files being attached or detached
- A workload that disappeared, and what reconciliation did about it
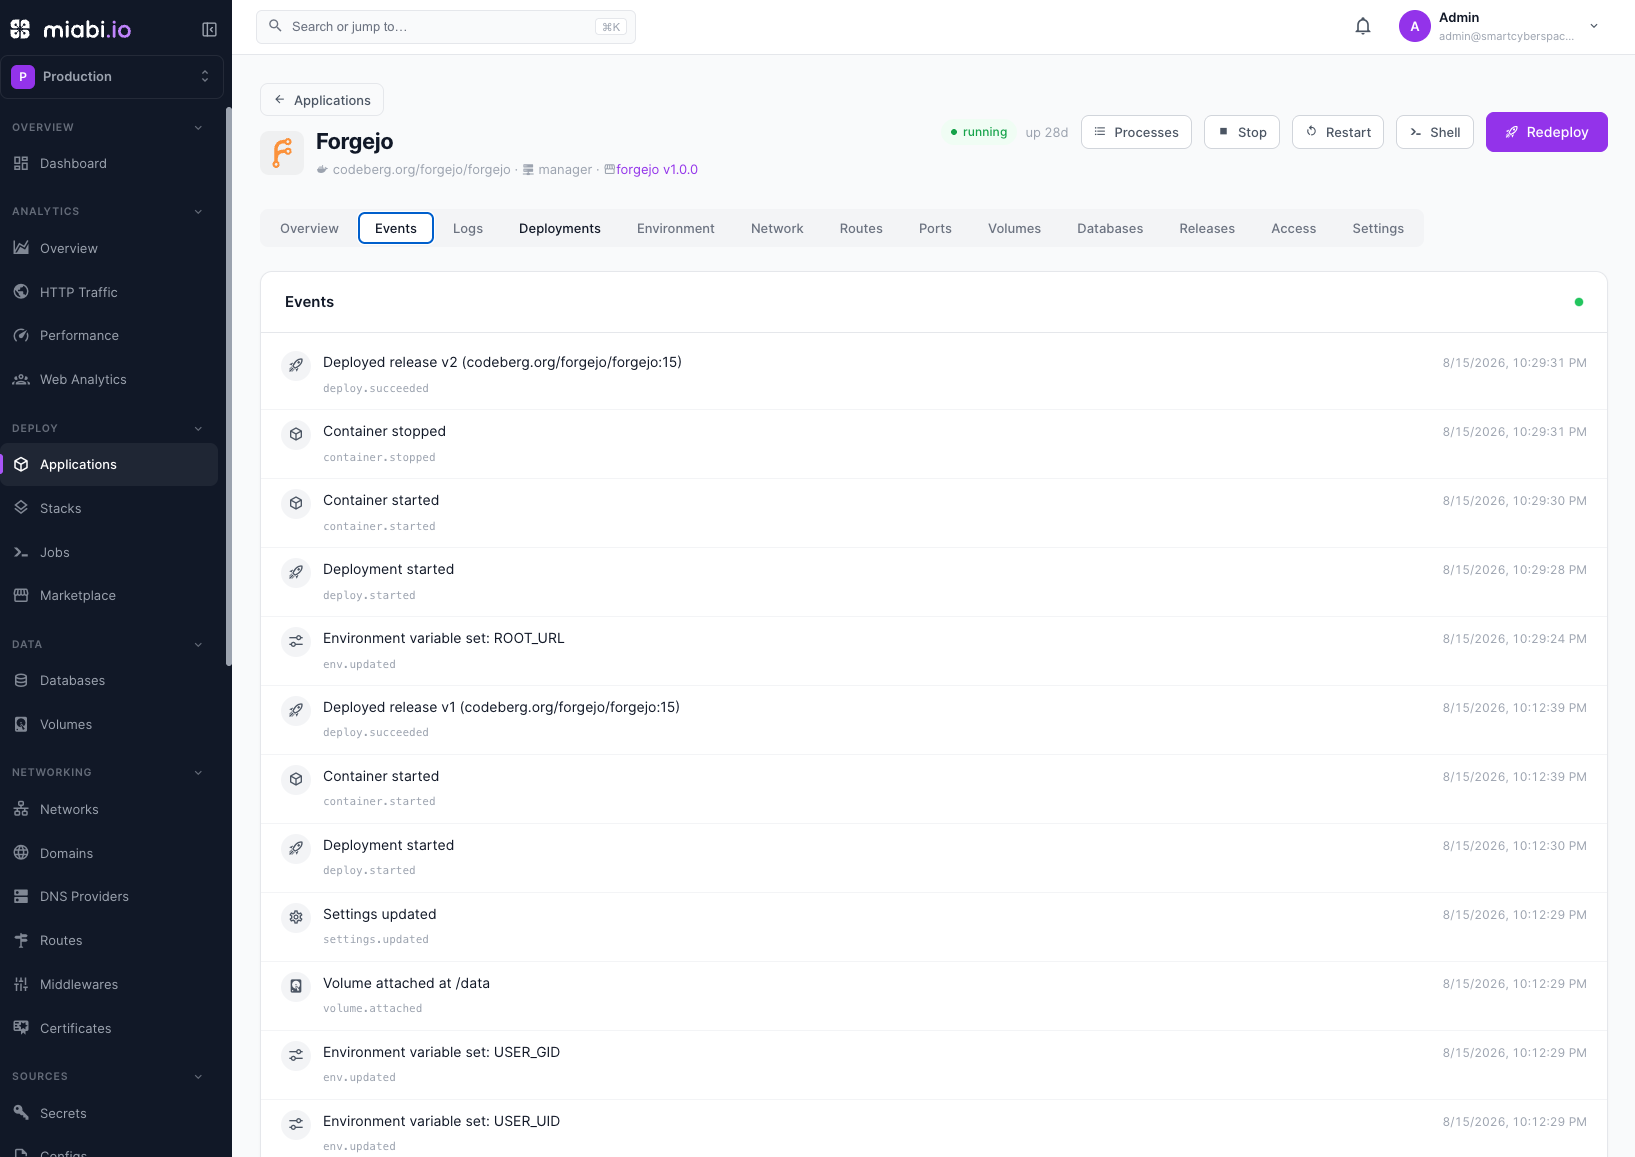
Where logs tell you what the app is outputting, the timeline tells you what happened to the app — a quick way to answer "what changed right before this started?"
Logs vs. timeline vs. audit vs. metrics
Miabi separates these concerns so each view stays focused:
| View | Answers | Scope |
|---|---|---|
| Logs | What is the app printing right now? | One application's containers |
| Timeline | What lifecycle events happened to this app? | One application |
| Audit log | Who did what across the workspace? | Whole workspace |
| Monitoring | How much CPU/memory/health? | Metrics over time |
Use the timeline to spot when something changed, the logs to see what the app said at that moment, the audit log to see who made the change, and monitoring to see the performance impact.
The timeline and the audit log overlap but aren't the same: the timeline is app-scoped and lifecycle-focused, while the audit log is the workspace-wide, security-grade record of every mutation.